Table of contents
Simple Integrated Geomorphological Numerical Model Simulations
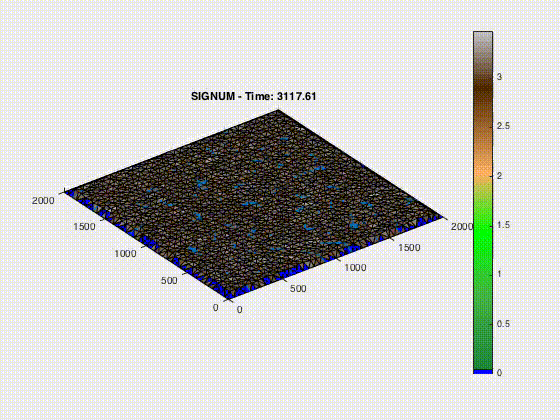
The processes that control erosion cause geomorphological events that describe earth’s surface. This includes aspects of geology that explain the development of landforms and how those landforms are pieced together to form vast landscapes. By modeling the erosion process a better prediction of future geologic reconstruction can be developed to provide a clear understanding of Earth’s geomorphology. Main formulations of erosion in this study include stream channeling through bedrock, uplift and linear diffusion. Here I only show the uplift model.
Uplift Model
This function calculates height variations where $u_{f}$ is a parameter that I edited under default parameters.
Code Snippet
In MATLAB, I changed the parameters for uplift, stream power, and linear diffusion, to be able to better understand how to model the morphological processes of mountain building. SIGNUM or Simple Integrated Geomorphological Numerical Model simulates sediment transport and erosion by river flow, hill slope diffusion, fluvial incision and tectonic uplift. These scripts use the stream power equation, linear diffusion and uplift rates to analyze the effects it has in the SIGNUM model. A code snippet of the uplift function is show here:
function dz = SIGNUM_uplift(uf,dt,buplift)
% This function can be used inside the SIGNUM model (see also SIGNUM.m) to
% simulate uniform uplift.
% Syntax:
%   dz = SIGNUM_uplift(uf,dt,buplift)
% Inputs:
%   points: (global) structure of surface points (see SIGNUM help for more info)
%   uf: uplift velocity (dz/dt) - can be an array of the same size as points
%   dt: time interval
%   buplift: flag controlling whether border points uplift or not
%    0 - all boundary points do not uplift,
%    1 - open boundary points (boundary=1) do not uplift,
%    2 - all boundary points uplift
%    (optional, default = 1)
% Outputs:
%   dz:      height variations

%     Copyright (C) 2011-2012  the authors
%
%     This program is free software: you can redistribute it and/or modify
%     it under the terms of the GNU General Public License as published by
%     the Free Software Foundation, either version 3 of the License, or
%     (at your option) any later version.
%
%     This program is distributed in the hope that it will be useful,
%     but WITHOUT ANY WARRANTY; without even the implied warranty of
%     MERCHANTABILITY or FITNESS FOR A PARTICULAR PURPOSE.  See the
%     GNU General Public License for more details.

global points;

if nargin<3
    buplift=1;
end

if isscalar(uf); %uf = repmat(uf,length(points),1); end;
    %dz = zeros(length(points),1);
    % Speed-up code: different loops for different boundary conditions
    dz = dt .* uf .* ones(length(points),1);
    switch buplift
        case 0
            dz([points(:).border] ~= 0) = 0;
        case 1
            dz([points(:).border] == 1) = 0;
        otherwise
    end
else
    dz = zeros(length(points),1);
    % Speed-up code: different loops for different boundary conditions
    switch buplift
        case 0
            for k = 1:length(points)
                if (points(k).border == 0)
                    dz(k) = dt .* uf(k);
                end
            end
        case 1
            for k = 1:length(points)
                if (points(k).border ~= 1)
                    dz(k) = dt .* uf(k);
                end
            end
        otherwise
            for k = 1:length(points)
                dz(k) = dt .* uf(k);
            end
    end
end
Glacier Numerical Modeling
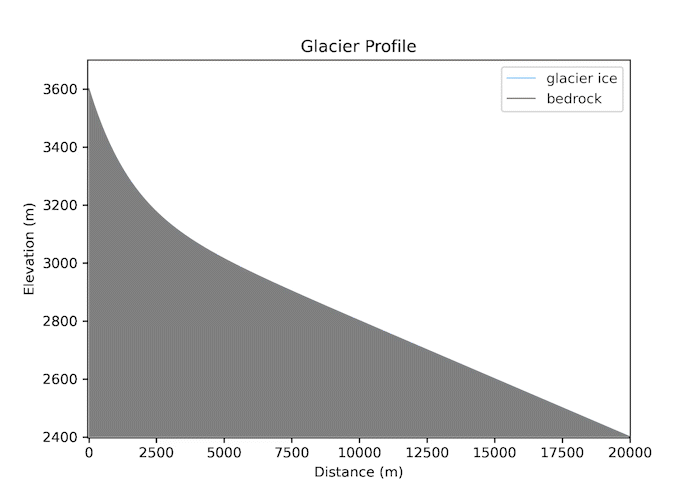
Valley glaciers are powerful geomorphic agents. The thickness of ice in a valley glacier reflects a balance between snow accumulation, melt/sublimation, and the gradient in ice flow.
Code Snippet
My python model simulates the growth of a valley glacier in 1D using a prescribed mass balance and a flow law for ice, as discussed in class. The glacier will form on an initial fluvial valley profile in response to a specified equilibrium-line altitude (ELA) and an elevational gradient in net mass balance. A code snippet of the model is shown here:
## INITIALIZE PARAMETERS

# Parameters
g = 9.81 # grav accel, m^2/s

# ice rheology
rho_ice = 917 # density of ice, kg/m^3
A = 6.28e-24 # Glen's flow law param is a function of temp
A = A * 365 * 24 * 3600 # converts to year timescales, Pa^-3 yr^-1
N = 3.0 # or 4, Glen's flow law power

# visualize Glen's flow law desc rheology of ice
dtau_test = 1.8e4
tau_test_max = 2.6e5

tau_test = np.arange(0, tau_test_max, dtau_test) # array of shear stresses

dudz_test = A * (tau_test**N) # shear strain rates here in 1/yr

# INITIALIZE ARRAYS

# distance array
xmax = 20000.0 # length of domain, m
dx = 50.0 # distance interval, m
x = np. arange(0, xmax+dx, dx)

# time arrays... all times in years
dt = 0.001
tmax = 1000.
t = np.arange(0, tmax+dt, dt)
imax = t.size
print(imax)


# INITIAL CONDITIONS

# bedrock topography
zbmax = 3600.0
zbramp = 3200.0
xstar = 1500.0
S0 = 0.04 # local slope of ramp, dz/dx
zb = zbramp - (S0*np.abs(x)) + (zbmax-zbramp) *np.exp(-x/xstar)
zb0 = zb # memorizes initial bedrock

# initial ice thickness, assumed uniform
H00 = 0.0
H0 = H00 * np.ones (np.size(x))
H = H0

# topography
z = zb + H # surface topography
z0 = z  # memorizes initial surface topography

# Climate forcing
z_ela = 3050.0 # equilibrium line elevation, ELA
dbdz = 0.015 # (m/y)/m elevation
bcap = 1.0 # caps the positive mass balance at high elevations
b = dbdz*(z-z_ela)
bmax = bcap*np.ones(b.size)
b = np.minimum(bmax,b)

# for plots
nplots = 50
tplot = tmax/nplots;

# initialize a figure to which we add snapshots Tevery time t = a multiple of tplot
fig4 = plt.figure()

# initialize an array of zeros for comparison with the H array within the loop
Hnot = np.zeros((x.size,), float)
nframe = 0
zlast = z # for plotting purposes

# ANIMATE, set up the movie ani
fig, ax = plt.subplots(1,1,figsize=(7,5)) # open a blank figure
n=-1
with writer.saving(fig, "glacier_movie_EAM10.mp4", dpi_movie): # ani, whole looop indented
    # RUN
    for i in range(imax):
        # update the local mass balance
        b = dbdz*(z-z_ela)
        bmax = bcap*np.ones(b.size)
        b = np.minimum (bmax,b)

        # calculate the analytic solution for the steady state ice discharge
        Qanalytic = np.cumsum(b)*dx
        Qanalytic[Qanalytic<0]=0

        # we are using a staggered grid so have to calculate the H at the edges of cells
        Hedge = 0.5 * (H[0:-1] + H[1:])

        # local slopes
        S = np.diff(z)/dx

        # Hedge and S will have the same length
        taub = rho_ice*g*Hedge*S;

        # mean ice speed (ignoring sliding)
        Ubar = (2.0*A/(N+2.0))*((np.abs (taub))**N)*Hedge;

        # ice discharge including zero flux boundary conditions at the edges
        Q = np.zeros(((Hedge.size+2),), float)
        Q[1:-1] = Ubar*Hedge # at the interior edges of the calculation space, zero fluxes at edge
        Q[0]=0
        Q[-1]=0

        # conserve ice
        dQdx = np.diff(Q)/dx

        # and update the ice thickness
        dHdt = b - dQdx
        H = H + (dHdt*dt)
        # prevents negative ice thicknesses
        H = np.maximum(H,Hnot)

        z = zb + H

        bottom = min(z)

        # plotting
        if (t[i]%tplot)==0: # plot only when the remainder of t(i) and tplot is zero
            n = n + 1 # ani

#             pylab.plot(x,z, 'xkcd:light blue', linewidth=1, label='glacier ice', alpha = np.exp(-t[i]/tmax))
            pylab.plot(x,z, 'xkcd:light blue', linewidth=1, label='glacier ice')
            pylab.plot(x,zb, 'grey', linewidth=1, label='bedrock')

            # color fill - glacier fill between the last and this ice surface
            x2 = np.flip(x,0)
            xfill = np.concatenate((x,x2), axis=0)

            z2= np.flip(z,0)
            zfill = np.concatenate((zlast,z2), axis=0)

            zb2= np.flip(zb,0)
            zbfill = np.concatenate((zlast,zb2), axis=0)
            plt.fill_between(xfill, zfill, zbfill, facecolor='xkcd:light blue', alpha = ((t[i])/tmax))
            pylab.fill(xfill, zfill,'b', alpha = ((t[i])/tmax))


            # color fill - bedrock
            plt.fill_between(x, zb, bottom, facecolor='grey')
            zlast = z
            plt.legend()

            pylab.xlim(-dx, xmax)
            pylab.xlabel('Distance (m)', fontsize=10)
            pylab.ylabel('Elevation (m)', fontsize=10)
            pylab.title("Glacier Profile", fontsize = 12)
            writer.grab_frame() # ani
        plt.clf()